


")

Genomic surveillance of SARS-CoV-2 in Russia: insights from the VGARus platform
- Authors: Kotov I.A.1,2, Agletdinov M.R.1,2, Roev G.V.1,2, Pimkina E.V.1, Nadtoka M.I.1, Peresadina A.V.1, Bukharina A.Y.1, Svetlichny D.V.1, Goncharov S.E.1, Vykhodtseva A.V.1, Borisova N.I.1, Lysenkov V.G.1, Chanyshev M.D.1, Agabalaev D.N.1, Saenko V.V.1, Cherkashina A.S.1, Semenenko T.A.3, Dubodelov D.V.1, Khafizov K.F.1, Akimkin V.G.1
-
Affiliations:
- Central Research Institute for Epidemiology
- Moscow Institute of Physics and Technology (National Research University)
- National Research Centre of Epidemiology and Microbiology named after the Honorary Academician N.F. Gamaleya
- Issue: Vol 101, No 4 (2024)
- Pages: 435-447
- Section: ORIGINAL RESEARCHES
- URL: https://journals.rcsi.science/0372-9311/article/view/264244
- DOI: https://doi.org/10.36233/0372-9311-554
- EDN: https://elibrary.ru/irjxcx
- ID: 264244
Cite item

Abstract
Introduction. In response to the COVID-19 pandemic in the Russian Federation, comprehensive response measures were taken. One of these measures was the development of a viral genome aggregation platform (VGARus) to monitor virus variability.
The aim of this paper is to describe the role of the VGARus platform in tracking genetic variation in SARS-CoV-2.
Materials and methods. VGARus utilizes sequencing data and bioinformatics tools to monitor genetic variations in SARS-CoV-2. The viral genomes were aligned using NextClade, which also translated them into amino acids and identified mutations. The viral variability over time was analyzed by counting the number of amino acid changes compared to the reference sequence.
Results. The analysis of data within VGARus enabled the identification of new virus variants, contributing to improved diagnostic tests and vaccine development. The platform allowed for the prediction of epidemiologic trends, facilitating a rapid response to changes in the epidemiologic situation. For example, using VGARus, an increase in COVID-19 incidence was accurately predicted in the summer of 2022 and early 2023, which were associated with the emergence of Omicron subvariants BA.5 and XBB. Data from the platform helps validate the effectiveness of primers and DNA probes to ensure high diagnostic accuracy and reduce the risk of false negatives.
Conclusion. VGARus demonstrates the growing role of genomic surveillance in combating COVID-19 and improving preparedness for future infectious disease outbreaks. The platform is a powerful tool for generating evidence-based solutions to combat a pandemic and mitigate its health, economic and societal impacts. It provides the ability to promptly obtain information on the epidemiologic situation in a particular region of the Russian Federation, use genomic data for phylogenetic analysis, compare the mutational spectrum of SARS-CoV-2 sequences with foreign samples. VGARus data allow for both retrospective analysis and predictive hypotheses. For example, we can clearly see the dynamics of the change of different virus variants: sequences belonging to the Alpha, Beta, Delta, Omicron lineages and many less common ones, clearly form the upsurges of morbidity, the interaction of which is reflected in the epidemiological picture. It is also currently being expanded to monitor other pathogens, increasing its public health relevance.
Full Text
Introduction
The advent of high-throughput sequencing technologies, also known as next-generation sequencing (NGS), has led to a significant reduction in the cost of genomic sequencing experiments over the past 15 years. NGS is increasingly utilized across various biological and medical fields, including virology, where its application in studying viral genomes has become widespread [1–5]. Furthermore, contemporary bioinformatics tools have expanded the capabilities for the development and analysis of databases containing the genomes of pathogens responsible for various infectious diseases [6–8]. Genomic epidemiology has emerged as a crucial component in epidemic control. It enables the examination of genetic alterations in the genomes of pathogens, the identification and classification of distinct lineages, and the evaluation of their pathogenic potential and transmissibility [9–15]. These studies are very important for the development of new diagnostic kits, the creation of modern and effective vaccines, the formulation of optimal epidemic response strategies, and the prediction of disease incidence.
A striking example of the application of molecular genetic monitoring is the detailed study of a new coronavirus infection during the COVID-19 pandemic [16]. By analyzing the genomes of SARS-CoV-2, associations were established between different virus variants and the characteristics of the course of the epidemic. This approach allows for accurate monitoring, understanding the relationship between genetic variants and their ability to cause disease, and implementing targeted measures to prevent the spread of infection.
At the onset of the COVID-19 pandemic, Professor Edward Holmes from the University of Sydney, representing a research team led by Yong-Zheng Zhang from Fudan University in Shanghai, published the nucleotide sequence of the SARS-CoV-2 genome. This information was posted on the Virological.org platform1, which allowed the international scientific community to begin taking immediate action to counter the spread of the pathogen, among which were the development of new diagnostic tests and subsequent vaccine development [17, 18]. As the pandemic progressed, countries that had typically relied less on their own genomic data began to conduct extensive sequencing experiments. The knowledge gained was used to develop strategic plans to contain the spread of infection [19]. The widespread use of SARS-CoV-2 genome sequencing led to a significant increase in the number of new sequences uploaded to international databases. The well-known database is GISAID (https://www.gisaid.org) with more than 16 million sequences from more than 200 countries [8].
The aim of the study is to determine the role of the VGARus platform and its data for analyzing genomic sequences of SARS-CoV-2 virus collected in Russia.
Materials and methods
Before starting this study, informed consent was obtained from patients, and the protocol was approved by the ethical committee of the Central Research Institute of Epidemiology (protocol No. 111 of 22.12.2020). Biological material was obtained by taking nasopharyngeal swabs from patients with COVID-19 symptoms. The samples were collected from different regions of Russia, with most of them coming from Moscow and the Moscow region. The presence of SARS-CoV-2 RNA was confirmed by real-time reverse transcription polymerase chain reaction (RT-PCR). RIBO-prep kit (AmpliSense, Russia) was used for RNA isolation, and REVERTA-L reagent kit (AmpliSense, Russia) was used for reverse transcription.
High-throughput sequencing was performed on the Illumina MiSeq platform (Illumina, San Diego, CA, USA) using MiSeq Reagent Kit v2 (PE 150 + 150 or PE 250 + 250 cycles) or MiSeq Reagent Kit v3 (PE 300 + 300 cycles), Illumina NextSeq 2000 using NextSeq 1000/2000 P2 reagents v3 (300 cycles), MinION using Midnight Kit (Oxford Nanopore Technologies Oxford, UK), DNBSEQ-G50 using ATOPlex RNA Library Prep Set (MGI Tech, Shenzhen, China). The Sanger method was used to sequencing fragments of the spike protein gene, but this information was barely utilized in the analysis. In addition, nucleotide sequence data from the GISAID database were used in case of their geographical affiliation to Russia. The program “Pangolin” [19], as well as internal tools and scripts, were used to classify different variants of SARS-CoV-2.
In total, more than 82,000 complete SARS-CoV-2 genomes with the date of biomaterial collection from 01.01.2020 to 31.12.2023 were used. Only genomic sequences that met the specified quality criteria were selected. The selected genomes were aligned to the reference sequence NC_045512.2 using the NextClade tool and then translated into amino acid sequences. A specialized script written in Python was used to count the number of amino acid changes compared to the reference.
Results
Development and creation of the Russian viral genome aggregation platform VGARus
In 2021, the VGARus platform (Virus Genome Aggregator of Russia; registration date 06.07.2023, No. 2023622263) was developed and established at the Central Research Institute of Epidemiology (CRIE) of Rospotrebnadzor in accordance with the decree of the Government of the Russian Federation. The key tasks of this platform are collection of data on viral genomes, centralized analysis of genetic diversity and temporal dynamics of identified SARS-CoV-2 variants in Russia. A scientific consortium was established, comprising institutions from Rospotrebnadzor, the Ministry of Health of the Russian Federation, various scientific institutes, and other organizations. Currently, more than 150 organizations are members of the consortium, many of which are actively conducting extensive genomic sequencing of SARS-CoV-2 and uploading the obtained sequences to the VGARus database for further analysis. In addition, the Republic of Armenia and the Republic of Belarus are participating in the project, which makes it possible to track pathogen variability in neighboring countries with active transport connections.
The process of monitoring viral genome variability involves the following steps (Figure 1):
- the sequencing laboratory receives biological material from diagnostic laboratories, including those affiliated with hospitals. The quality of these samples is preliminarily assessed, typically through PCR analysis, to determine viral load and assess the sample’s suitability for next-generation sequencing (NGS);
- the laboratory that provided the biological material must enter the relevant metadata into the VGARus platform (information on sex, age, vaccination status of the patient, date of collection of the biological material, region of collection, etc.);
- a specialized sequencing laboratory conducts the essential sample preparation followed by the sequencing of viral genomes;
- primary bioinformatics analysis is performed, which includes data quality control, genome assembly (usually by alignment to a reference genome) and sequence validity check (assessment of genome coverage);
- uploaded genomic information is validated and processed automatically using the “Pangolin” program for complete genomes [19, 20] and the “V-TRACE” program (developed by CRIE) for fragment sequencing results. Samples with genomes that fail quality control are marked as invalid on the platform, and a corresponding notification is sent to the originating laboratory.

Fig. 1. The stages of the process of monitoring the variability of viral genomes.
All SARS-CoV-2 genomic sequences in the country, obtained through routine epidemiologic monitoring, are registered in the VGARus database. The system supports both manual uploading and uploading via specialized APIs, facilitating the addition of large volumes of sequences. Each sample entry in the system includes not only the nucleotide sequence but also associated technical data. Upon registration in the database, the sample is automatically assigned an internal identifier, and the SARS-CoV-2 genome sequence is appended to the sample information field. The technical information encompasses data on the organizations involved in sample collection and laboratory processing, the dates of sample receipt, registration in the system, and sequence upload.
The S-protein SARS-CoV-2 plays a key role in virus variant identification. This is due to its role in virion entry into host cells and high mutation frequency/variability of the sequence [21]. However, attempting to establish a virus variant solely on the basis of mutations in the S-protein gene may lead to incomplete or inconsistent results [22]. Given the complexity of viral evolution, in which individual mutations may affect virus functions differently and interact in ways that may alter the overall effect, bioinformaticians at the Central Research Institute for Virus Evolution have developed the V-TRACE algorithm to address this problem. The algorithm identifies mutations in the S-protein gene of SARS-CoV-2, after which a plausibility measure of whether the sequence under study belongs to different virus lineages is estimated.
Temporal dynamics and evolutionary trajectories of SARS-CoV-2 variants
The VGARus platform is a valuable resource for tracking the dynamics of the COVID-19 pandemic in Russia and studying its peculiarities. In particular, systematically collected sequence information allows us to study the genomic diversity of the virus.
In 2020, a substantial diversity of SARS-CoV-2 lineages was observed [23]. These lineages did not exhibit significant advantages over one another, resulting in none of the variants becoming dominant. In December 2020, about a year after the new coronavirus began to spread worldwide, the UK authorities informed the World Health Organization of the discovery of a new SARS-CoV-2 lineage, named VOC-202012/01. It had numerous mutations in its genome and was originally named “British” but was later renamed Alpha to avoid naming variants by country. Among the mutations found in the S-protein gene, the most important were N501Y, P681H and Δ69-70 [24, 25]. These mutations affected the ability of the virus to infect cells and evade the host immune response and, as a consequence, allowed it to spread more efficiently. This variant was detected in Russia in late 2020 and persisted into early 2021, coinciding with a sharp increase in the number of cases.
The Beta variant was identified shortly thereafter, but it had a much lower prevalence than Alpha. In the spring of 2021, the Delta variant appeared and quickly became dominant, leading to a significant increase in the incidence and hospitalization rate [26]. After a period of relatively favorable epidemiological conditions, the Omicron variant appeared in December 2021 (Figure 2), which led to a marked increase in the number of cases in Russia. However, the incidence of the disease declined just as quickly.

Fig. 2. A diagram illustrating the occurrence of significant SARS-CoV-2 variants of concern in the Russian Federation throughout 2020 until the March of 2024.
Despite a period of low numbers of COVID-19 cases in the spring of 2022, the emergence of Omicron subvariants BA.4 and BA.5 caused an increase in incidence that lasted until the end of October (Figure 3). In late 2022 and early 2023, highly contagious variants such as BQ.1* emerged. Such shifts in dominant lineages well illustrate the ever-changing and complex nature of SARS-CoV-2 evolution. Notably, in early 2023, modified versions of pre-existing lineages returned to the virus population, notably Omicron BA.2, presented as recombinant forms of XBB*. In November 2023, a variant of coronavirus BA.2.86, unofficially named Pirola, began to spread rapidly in several countries, including Russia. It was notable for the large number of accumulated changes in the genome compared to earlier lineages and by the end of 2023 had become the predominant virus lineage, and in early 2024 its JN.1 sublineage was almost completely dominant in most countries of the world.

Fig. 3. Chart showing the frequency of occurrence of various Omicron sublineages from early 2022 to March of 2024.
The rise in the prevalence of the BA.2 sublineage by the end of 2023 is attributed to the BA.2.86 variant.
The pathogen variability described above underscores the importance of ongoing epidemiologic monitoring and sequencing of virus genomes for the timely detection of new variants or changes in viral population structure. Rapid identification of such changes can help in the development of public health strategies and in controlling the spread of these variants.
Comparative analysis of Figure 2 and Figure 3 reveals a trend wherein each new significant virus lineage becomes dominant once it reaches a threshold of 50% of the total population size, typically within 1.5 to 3.0 months. Additionally, the period during which an individual lineage remains dominant ranges from 3 months to 1 year.
We then attempted to explain the dynamics of COVID-19 incidence in Russia and to explore the possibility of predicting the rate of spread of a particular virus sublineage on the basis of SARS-CoV-2 sequence data. Our main hypothesis is that specific mutations in the virus genome significantly affect the incidence rate. However, the reported incidence rate undoubtedly depends on other critical factors such as population immunization rates, PCR testing coverage, and seasonal factors, whose exact contribution is difficult to estimate. Therefore, these factors were not used for the analysis.
The period from May 2020 to December 2023 was divided into 21-day intervals. The time period studied was limited to December 2023, allowing for a detailed examination of trends at that time. However, the subsequent emergence of the BA.2.86 variant has shown that predicting future trends can be extremely difficult. Given the key role that missense mutations play in viral transmission rates, nucleotide sequences were aligned to the reference genome and translated into amino acid sequences using NextClade [27]. The number of amino acid changes compared to the reference sequence was chosen as a metric of viral variability. For example, a rapid increase in the number of frequently occurring changes may indicate an active mutational process or the importation of a new lineage into the study region. The higher the mutational activity of a virus, the more likely it is that some subset of acquired mutations can affect the properties of the virus, such as its transmissibility.
The amino acid changes compared to the reference sequence from May 2020 to December 2023 are represented by the black line in Figure 4. For each interval, only mutations with a frequency of at least 50% are plotted. This approach enables the evaluation of mutations that significantly affect the adaptability of a viral variant or are inherited alongside such mutations. The graph clearly highlights three distinct intervals during which the number of frequent mutations in the SARS-CoV-2 genome increased. These intervals correspond to June 2021, February 2022, and January 2023, aligning with the widespread distribution of the Delta, Omicron, and XBB variants in Russia, respectively.

Fig. 4. Changes in amino acid sequences compared to the reference sequence from May 2020 to December 2023.
1 — number of amino acid substitutions relative to the reference variant (NC_045512.2) with a frequency of 50% or higher; 2 — number of changes in the set of mutations with a frequency of at least 50% compared to the previous period; 3 — temporal dynamics of COVID-19 cases in Russia according to WHO data.
One potential limitation of the method described above is that it cannot effectively reflect the dynamics of change when new and old dominant lineages have different characteristic mutations, but their absolute number differs only slightly. A simple counting of mutations in such a case will lead to the erroneous conclusion that genetic evolution does not occur. To solve this problem, the qualitative composition of mutations was analyzed.
Sets of amino acid changes with a frequency greater than 50% were considered as separate sets for each time interval. Differences between them for adjacent time intervals were evaluated and used to measure the genetic variability of the virus. In this case, both the appearance and disappearance of a mutation with a frequency of at least 50% compared to the previous period was considered a change (Figures 2, 4). This auxiliary strategy demonstrated its reliability. Thanks to its application, we observed qualitative changes in the set of frequent mutations in the population caused by the transition from lineage BA.1 to BA.2. At the same time, fluctuations in the absolute number of common mutations were minimal. Both data sets described above are consistent with the World Health Organization data on the incidence of SARS-CoV-2 in Russia (Figures 3, 4).
Increases in disease incidence are often preceded by significant changes in the pathogen genome, as was the case in the summer of 2021 with the appearance of the Delta variant, in December 2021 with Omicron (BA.1/BA.2), in July 2022 with Omicron (BA.5), and in early 2023 with XBB (Figure 5). However, seasonal factors also play an important role.

Fig. 5. Dynamics of the frequency distribution of amino acid mutations.
The lines indicate trends associated with changes in the dominant virus lineage. Each point represents a mutation plotted on the timeline, with its position indicating the frequency of occurrence at the time of sample collection. The major lineages leading to changes in mutation frequencies are shown. Local trends are highlighted with dashed lines.
We investigated the dynamics of mutation frequencies in the SARS-CoV-2 genome in Russia (Figure 5). It was noted that during the spread of the new dominant lineage at the above-mentioned time points, the frequency of mutations characteristic of them demonstrated a rapid S-shaped growth. When the new lineage began to dominate in the country, the frequency of mutations characteristic of the replaced lineage decreased along a similar S-shaped trajectory. In addition to the general picture, local trends can be observed on the mutation frequency distribution graph.
The frequency distribution of mutations also reveals two distinct trends on the right side of the graph. A more precise analysis of the mutations and sequences comprising these trends shows that both groups of lineages include XBB.1.9.1, FL.24, FL.1.5.1, XBB.1.16, XBB.1.16.11, and XBB.1.16.17. The upper trend, situated in the high-frequency range (70–90%) and indicated by the green dashed line, is formed by mutations common to all these lineages, such as S:G252V and ORF1b:S959P. Meanwhile, in the low-frequency range, the trend indicated by the dashed line is formed by mutations found in subgroups of the same lineages, such as S:E180V, which is present only in XBB.1.16, XBB.1.16.11, and XBB.1.16.17, and ORF1a:G1819S, found in the remaining lineages.
Studying the spreading dynamics of these lineages with time can potentially help predict the evolution of SARS-CoV-2. For this reason, the frequency dynamics for several of the discussed sublineages from June through December 2023 are presented in Figure 6. Lineages XBB.1.9.1 and XBB.1.16 were intentionally excluded from this analysis due to the decreasing or static nature of their frequency trend during the period under consideration. The former line significantly decreased its prevalence to almost zero, while the latter line did not change its frequency, remaining between 6–16%. Consequently, they are not considered potentially future dominant lineages.

Fig. 6. Prevalence of SARS-CoV-2 from June 2023 through mid-December 2023.
However, after this period, the BA.2.86* (“Pirola”) lineage became dominant shortly after XBB, which could not have been predicted from data obtained by mid-December 2023, when this lineage was found in only a few samples. Figure 6 also shows that most of the lineages previously considered potentially dominant, although becoming more common, reach a frequency of only about 16% in a few months. Meanwhile, earlier observations in this study suggest that a dominant line typically reaches 50% frequency within 1.5–3.0 months of emergence.
These data suggest that a future potentially dominant lineage must possess a certain minimum spreading rate; otherwise, it is likely to be displaced by others. This hypothesis aligns with the periodic nature of lineage changes. Additionally, such events complicate the prediction of the pandemic’s trajectory, particularly in determining the dominant lineage in the near future and its impact on public health. Finally, the rapid emergence and spread of an entirely new variant can render all previous predictions irrelevant.
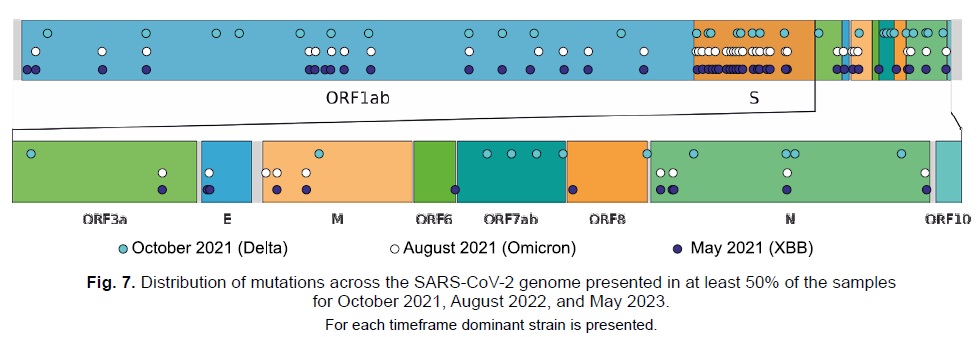
Data on the distribution of mutations in the genome were also obtained. Figure 7 highlights mutations that reached a frequency of at least 50% at the considered time points. Many of these mutations were found in the S-protein gene, which aligns with the findings of other research groups [28]. It is notable that each new dominant lineage introduces progressively fewer new mutations in this gene. While it is challenging to interpret this observation unambiguously at present, it may suggest the degree of relatedness between the lineages or that the gene is approaching its optimal structure for maximizing affinity to the human ACE2 receptor.

Fig. 7. Distribution of mutations across the SARS-CoV-2 genome presented in at least 50% of the samples for October 2021, August 2022, and May 2023.
For each timeframe dominant strain is presented.
Discussion
The development of the Russian viral genome aggregation platform VGARus has become an important aspect in the fight against the COVID-19 pandemic in the country. This database contains over 320,000 SARS-CoV-2 genome sequences, including approximately 200,000 complete genomes. VGARus supports many essential functions, such as the identification of novel virus variants, the creation of effective diagnostic tools, and the formulation of public health policies [12–15].
VGARus has significantly contributed to the understanding of the spatial and temporal dynamics of the COVID-19 pandemic. By providing detailed information on the time and location of each genomic sample, the platform allows visualizing the distribution of specific viral variants in Russia and their evolution over time. This detailed knowledge provides an important advantage in predicting epidemiologic trends in the coming months. For example, using VGARus, we accurately predicted an increase in COVID-19 incidence in the summer of 2022 and early 2023, associated with the emergence of Omicron BA.5 and XBB subvariants, respectively. These predictive capabilities enable public health authorities to respond rapidly to changing epidemiologic situations.
In general, the results presented above on the frequency of occurrence of various SARS-CoV-2 variants in Russia are consistent with the data of other studies in different countries. For example, B. Xiao et al. used data from the GISAID platform [29]. They considered sequences obtained in the period from January 2020 to May 20, 2023 in the USA, UK, India, South Africa, Brazil, and Russia. During this period, the GISAID platform collected about 79,000 genomes from Russia.
The overall picture of the evolution and spread of the virus in different countries is similar, but there are significant regional differences. For example, in the USA and the UK, the peak proportion of the Alpha variant was about 65% and 100%, respectively. At the same time, in Russia, the estimate of its peak prevalence was about 40%, according to the foreign study, and 20% in the current work. This difference can be explained by a wider geography of our study than the one based only on GISAID data.
The Delta variant arrived in Russia in approximately the same period as in the other countries studied — April–May 2021. Exceptions included India, where this variant appeared in March 2021, and Brazil, where the spread of the strain began only in July 2021. As in most of the other countries studied, the Gamma variant was practically undetectable in Russia, while it was dominant in Brazil and was registered in the USA with a peak frequency of about 10%.
The frequency dynamics of the BA.1 and BA.2 sublineages were nearly identical in Russia and all the countries studied, except for India. In India, BA.1 did not become dominant, remaining below 40%, while BA.2 spread earlier and remained dominant for almost 8 months. A unique characteristic of Russia and India was the almost complete absence of BA.4, which was found in other countries with peak frequencies ranging from 20% to 60%.
The presented comparison demonstrates that individual virus variants may begin their spread in different regions of the planet with a difference of several months, and the time of their maximum prevalence may vary considerably. The data on the frequency dynamics of SARS-CoV-2 variants are consistent with the findings on the timing of their spread and dominance made in this study.
In this study, we also demonstrated the main capabilities of the VGARus platform, presented the dynamics of variant diversity and mutations of SARS-CoV-2 in Russia, and examined in detail the scenario preceding the change of the dominant lineage in December 2023. The results of this part of the study revealed certain limitations in predicting the dominant lineage in the near future. These limitations, caused by the rapid emergence of new lineages subsequently becoming dominant, represent a significant challenge for existing prediction tools [30, 31]. Nevertheless, we remain optimistic that future approaches will effectively address this factor. This work has, however, highlighted some general trends in the course of a pandemic, with the periodic nature of the change in the dominant variant being particularly crucial.
In addition to its role in tracking the course of epidemics, VGARus has practical implications, such as the development and assessment of diagnostic tests. For example, researchers at the Central Research Institute of Epidemiology regularly use VGARus data to test the effectiveness of primers and DNA probes used in test kits.Thus, the platform provides information for the development and processing of oligonucleotides for diagnostic test systems, information about the variants circulating in the country, about the variability of the pathogen sequence in the annealing site of primers and probes [32].
The capabilities of the VGARus platform have now been extended beyond SARS-CoV-2 research. The platform is currently being expanded to include data on additional pathogens, such as the viruses causing hepatitis, influenza, varicella, measles, and others. This multi-pathogen functionality will serve as a valuable tool for virologists and infectious disease specialists, enabling enhanced monitoring of the spread of various diseases and facilitating timely public health interventions.
Overall, VGARus is a significant achievement of the joint efforts of numerous scientific institutes of Rospotrebnadzor and other agencies [12]. Its implementation has expanded our understanding of SARS-CoV-2 and contributed to the study and control of the COVID-19 pandemic. VGARus emphasizes the critical importance of epidemiological monitoring in controlling infectious disease outbreaks and the significance of collaborative efforts in addressing global health crises.
1 Novel 2019 Coronavirus Genome.
URL: https://virological.org/t/novel-2019-coronavirus-genome/319
About the authors
Ivan A. Kotov
Central Research Institute for Epidemiology; Moscow Institute of Physics and Technology (National Research University)
Email: samurnihs@gmail.com
ORCID iD: 0000-0003-2416-5689
bioinformatician, Laboratory for genomic research, Central Research Institute for Epidemiology, postgraduate student, Moscow Institute of Physics and Technology (National Research University)
Russian Federation, Moscow; DolgoprudnyMatvey R. Agletdinov
Central Research Institute for Epidemiology; Moscow Institute of Physics and Technology (National Research University)
Email: m.agletdinov2018@gmail.com
ORCID iD: 0000-0003-2249-7196
bioinformatician, Laboratory for genomic research, Central Research Institute for Epidemiology, postgraduate student, Moscow Institute of Physics and Technology (National Research University)
Russian Federation, Moscow; DolgoprudnyGerman V. Roev
Central Research Institute for Epidemiology; Moscow Institute of Physics and Technology (National Research University)
Email: roevherman@gmail.com
ORCID iD: 0000-0002-2353-5222
bioinformatician, Laboratory for genomic research, Central Research Institute for Epidemiology, postgraduate student, Moscow Institute of Physics and Technology (National Research University)
Russian Federation, Moscow; DolgoprudnyEkaterina V. Pimkina
Central Research Institute for Epidemiology
Email: tsibina@cmd.su
ORCID iD: 0000-0002-0591-3525
junior researcher, Scientific group of genetic technology, Laboratory for genomic research
Russian Federation, MoscowMaksim I. Nadtoka
Central Research Institute for Epidemiology
Email: nadtoka@cmd.su
ORCID iD: 0009-0002-3217-0963
researcher, Scientific group of genetic technology, Laboratory for genomic research
Russian Federation, MoscowArina V. Peresadina
Central Research Institute for Epidemiology
Email: Peresadina@cmd.su
ORCID iD: 0009-0002-4981-6716
bioinformatician, Laboratory for genomic research
Russian Federation, MoscowAnna Yu. Bukharina
Central Research Institute for Epidemiology
Email: bukharina@cmd.su
ORCID iD: 0000-0002-6892-3595
junior researcher, Scientific group of genetic technology, Laboratory for genomic research
Russian Federation, MoscowDmitry V. Svetlichny
Central Research Institute for Epidemiology
Email: svetlichnyi@cmd.su
ORCID iD: 0009-0008-6864-2807
junior researcher, Scientific group of genetic technology, Laboratory for genomic research
Russian Federation, MoscowSergey E. Goncharov
Central Research Institute for Epidemiology
Email: Goncharov@cmd.su
ORCID iD: 0009-0000-2842-5818
laboratory assistant-researcher, Scientific group of genetic technology, Laboratory for genomic research
Russian Federation, MoscowAnastasiia V. Vykhodtseva
Central Research Institute for Epidemiology
Email: vihodceva@cmd.su
ORCID iD: 0009-0005-1911-9620
technologist, Scientific group of genetic technology, Laboratory for genomic research
Russian Federation, MoscowNadezhda I. Borisova
Central Research Institute for Epidemiology
Email: borisova@cmd.su
ORCID iD: 0000-0002-9672-0648
junior researcher, Scientific group of genetic technology, Laboratory for genomic research
Russian Federation, MoscowVladislav G. Lysenkov
Central Research Institute for Epidemiology
Email: vladislav.lysenkov@gmail.com
ORCID iD: 0000-0002-1468-1631
bioinformatician, Laboratory for genomic research
Russian Federation, MoscowMikhail D. Chanyshev
Central Research Institute for Epidemiology
Email: Chanyshev@cmd.su
ORCID iD: 0000-0002-6943-2915
Cand. Sci. (Biol.), senior researcher, Laboratory for genomic research
Russian Federation, MoscowDavid N. oglu Agabalaev
Central Research Institute for Epidemiology
Email: Agabalaev@cmd.su
ORCID iD: 0000-0001-8125-355X
bioinformatician, Laboratory for genomic research
Russian Federation, MoscowValeriia V. Saenko
Central Research Institute for Epidemiology
Email: valeriia.kaptelova@gmail.com
ORCID iD: 0000-0003-0952-0830
researcher, Scientific group of genetic technology, Laboratory for genomic research
Russian Federation, MoscowAnna S. Cherkashina
Central Research Institute for Epidemiology
Email: cherkashina@pcr.ms
ORCID iD: 0000-0001-7970-7495
Cand. Sci. (Chem.), Head, Scientific group of genetic engineering and biotechnology
Russian Federation, MoscowTatiana A. Semenenko
National Research Centre of Epidemiology and Microbiology named after the Honorary Academician N.F. Gamaleya
Email: meddy@inbox.ru
ORCID iD: 0000-0002-6686-9011
D. Sci. (Med.), Professor, Scientific advisor, Epidemiology department
Russian Federation, MoscowDmitry V. Dubodelov
Central Research Institute for Epidemiology
Email: dubodelov@cmd.su
ORCID iD: 0000-0003-3093-5731
senior researcher, Laboratory of viral hepatitis
Russian Federation, MoscowKamil F. Khafizov
Central Research Institute for Epidemiology
Author for correspondence.
Email: khafizov@cmd.su
ORCID iD: 0000-0001-5524-0296
Cand. Sci. (Biol.), Head, Laboratory for genomic research
Russian Federation, MoscowVasily G. Akimkin
Central Research Institute for Epidemiology
Email: vgakimkin@yandex.ru
ORCID iD: 0000-0003-4228-9044
D. Sci. (Med.), Professor, Full Memeber of RAS, Director
Russian Federation, MoscowReferences
- Barzon L., Lavezzo E., Militello V., et al. Applications of next-generation sequencing technologies to diagnostic virology. Int. J. Mol. Sci. 2011;12(11):7861–84. DOI: https://doi.org/10.3390/ijms12117861
- Quer J., Colomer-Castell S., Campos C., et al. Next-generation sequencing for confronting virus pandemics. Viruses. 2022;14(3):600. DOI: https://doi.org/10.3390/v14030600
- Capobianchi M.R., Giombini E., Rozera G. Next-generation sequencing technology in clinical virology. Clin. Microbiol. Infect. 2013;19(1):15–22. DOI: https://doi.org/10.1111/1469-0691.12056
- Singh D.D. Next-generation sequencing technologies as emergent tools and their challenges in viral diagnostic. Biomed. Res. 2018;29(8):1637–44. DOI: https://doi.org/10.4066/biomedicalresearch.29-18-362
- Mokili J.L., Rohwer F., Dutilh B.E. Metagenomics and future perspectives in virus discovery. Curr. Opin. Virol. 2012;2(1): 63–77. DOI: https://doi.org/10.1016/j.coviro.2011.12.004
- Akermi S., Jayant S., Ghosh A., et al. Viroinformatics for Viral diseases: tools and databases. In: Translational Bioinformatics in Healthcare and Medicine. Elsevier;2021:171–82.
- Olson R.D., Assaf R., Brettin T., et al. Introducing the Bacterial and Viral Bioinformatics Resource Center (BV-BRC): a resource combining PATRIC, IRD and ViPR. Nucleic. Acids. Res. 2023; 51(D1):D678–89. DOI: https://doi.org/10.1093/nar/gkac1003
- Shu Y., McCauley J. GISAID: Global initiative on sharing all influenza data — from vision to reality. Euro. Surveill. 2017;22(13):30494. DOI: https://doi.org/10.2807/1560-7917.ES.2017.22.13.30494
- Hill V., Ruis C., Bajaj S., et al. Progress and challenges in virus genomic epidemiology. Trends Parasitol. 2021;37(12):1038–49. DOI: https://doi.org/10.1016/j.pt.2021.08.007
- Giovanetti M., Slavov S.N., Fonseca V., et al. Genomic epidemiology of the SARS-CoV-2 epidemic in Brazil. Nat. Microbiol. 2022;7(9):1490–500. DOI: https://doi.org/10.1038/s41564-022-01191-z
- Klink G.V., Safina K.R., Nabieva E., et al. The rise and spread of the SARS-CoV-2 AY.122 lineage in Russia. Virus Evol. 2022;8(1):veac017. DOI: https://doi.org/10.1093/ve/veac017
- Akimkin V., Semenenko T.A., Ugleva S.V., et al. COVID-19 epidemic process and evolution of SARS-CoV-2 genetic variants in the Russian Federation. Microbiol. Res. 2024;15(1):213–24.
- Акимкин В.Г., Попова А.Ю., Плоскирева А.А. и др. COVID-19: эволюция пандемии в России. Сообщение I: проявления эпидемического процесса COVID-19. Журнал микробиологии, эпидемиологии и иммунобиологии. 2022; 99(3):269–286. Akimkin V.G., Popova A.Yu., Ploskireva A.A., et al. COVID-19: the evolution of the pandemic in Russia. Report I: manifestations of the COVID-19 epidemic process. Journal of microbiology, epidemiology and immunobiology. 2022;99(3):269–286. doi: 10.36233/0372-9311-276
- Акимкин В.Г., Попова А.Ю., Хафизов К.Ф. и др. COVID-19: эволюция пандемии в России. Сообщение II: динамика циркуляции геновариантов вируса SARS-CoV-2. Журнал микробиологии, эпидемиологии и иммунобиологии. 2022; 99(4):381–396. Akimkin V.G., Popova A.Yu., Khafizov K.F., et al. COVID-19: evolution of the pandemic in Russia. Report II: dynamics of the circulation of SARS-CoV-2 genetic variants. Journal of microbiology, epidemiology and immunobiology. 2022;99(4):381–396. doi: 10.36233/0372-9311-295
- Акимкин В.Г., Семененко Т.А., Хафизов К.Ф. и др. Стратегия геномного эпидемиологического надзора. Проблемы и перспективы. Журнал микробиологии, эпидемиологии и иммунобиологии. 2024;101(2):163–172. Akimkin V.G., Semenenko T.A., Khafizov K.F., et al. Genomic surveillance strategy. Problems and perspectives. Journal of microbiology, epidemiology and immunobiology. 2024;101(2):163–172. doi: 10.36233/0372-9311-507
- Hill V., Githinji G., Vogels C.B.F., et al. Toward a global virus genomic surveillance network. Cell Host Microbe. 2023;31(6): 861–73. DOI: https://doi.org/10.1016/j.chom.2023.03.003
- Lu R., Zhao X., Li J., et al. Genomic characterisation and epidemiology of 2019 novel coronavirus: implications for virus origins and receptor binding. Lancet. 2020;395(10224):565–74. DOI: https://doi.org/10.1016/S0140-6736(20)30251-8
- Corman V.M., Landt O., Kaiser M., et al. Detection of 2019 novel coronavirus (2019-nCoV) by real-time RT-PCR. Euro Surveill. 2020;25(3):2000045. DOI: https://doi.org/10.2807/1560-7917.ES.2020.25.3.2000045
- Rambaut A., Holmes E.C., O'Toole Á., et al. A dynamic nomenclature proposal for SARS-CoV-2 lineages to assist genomic epidemiology. Nat. Microbiol. 2020;5(11):1403–7. DOI: https://doi.org/10.1038/s41564-020-0770-5
- O'Toole Á., Scher E., Underwood A., et al. Assignment of epidemiological lineages in an emerging pandemic using the pangolin tool. Virus. Evol. 2021;7(2):veab064. DOI: https://doi.org/10.1093/ve/veab064
- Lan J., Ge J., Yu J., et al. Structure of the SARS-CoV-2 spike receptor-binding domain bound to the ACE2 receptor. Nature. 2020;581(7807):215–20. DOI: https://doi.org/10.1038/s41586-020-2180-5
- O'Toole Á., Pybus O.G., Abram M.E., et al. Pango lineage designation and assignment using SARS-CoV-2 spike gene nucleotide sequences. BMC Genomics. 2022;23(1):121. DOI: https://doi.org/10.1186/s12864-022-08358-2
- Komissarov A.B., Safina K.R., Garushyants S.K., et al. Genomic epidemiology of the early stages of the SARS-CoV-2 outbreak in Russia. Nat. Commun. 2021;12(1):649. DOI: https://doi.org/10.1038/s41467-020-20880-z
- Liu Y., Liu J., Plante K.S., et al. The N501Y spike substitution enhances SARS-CoV-2 infection and transmission. Nature. 2022;602(7896):294–9. DOI: https://doi.org/10.1038/s41586-021-04245-0
- Lista M.J., Winstone H., Wilson H.D., et al. The P681H mutation in the spike glycoprotein of the Alpha variant of SARS-CoV-2 escapes IFITM restriction and is necessary for type I Interferon resistance. J. Virol. 2022;96(23):e0125022. DOI: https://doi.org/10.1128/jvi.01250-22
- Борисова Н.И., Котов И.А., Колесников А.А. и др. Мониторинг распространения вариантов SARS-CoV-2 (Coronaviridae: Coronavirinae: Betacoronavirus; Sarbecovirus) на территории московского региона с помощью таргетного высокопроизводительного секвенирования. Вопросы вирусологии. 2021;66(4):269–78. Borisova N.I., Kotov I.A., Kolesnikov A.A., et al. Monitoring the spread of the SARS-CoV-2 (Coronaviridae: Coronavirinae: Betacoronavirus; Sarbecovirus) variants in the Moscow region using targeted high-throughput sequencing. Problems of Virology. 2021; 66(4):269–78. DOI: https://doi.org/10.36233/0507-4088-72 EDN: https://elibrary.ru/qdsujp
- Aksamentov I., Roemer C., Hodcroft E., Neher R. Nextclade: clade assignment, mutation calling and quality control for viral genomes. J. Open Source Softw. 2021;6(67):3773. DOI: https://doi.org/10.21105/joss.03773
- Kumar R., Srivastava Y., Muthuramalingam P., et al. Understanding mutations in human SARS-CoV-2 spike glycoprotein: a systematic review & meta-analysis. Viruses. 2023;15(4):856. DOI: https://doi.org/10.3390/v15040856
- Xiao B., Wu L., Sun Q., et al. Dynamic analysis of SARS-CoV-2 evolution based on different countries. Gene. 2024;916:148426. DOI: https://doi.org/10.1016/j.gene.2024.148426
- Fernandes Q., Inchakalody V.P., Merhi M., et al. Emerging COVID-19 variants and their impact on SARS-CoV-2 diagnosis, therapeutics and vaccines. Ann. Med. 2022;54(1):524–40. DOI: https://doi.org/10.1080/07853890.2022.2031274
- Raghwani J., du Plessis L., McCrone J.T., et al. Genomic epidemiology of early SARS-CoV-2 transmission dynamics, Gujarat, India. Emerg. Infect. Dis. 2022;28(4):751–8. DOI: https://doi.org/10.3201/eid2804.212053
- Kotov I., Saenko V., Borisova N., et al. Effective approaches to study the genetic variability of SARS-CoV-2. Viruses. 2022;14(9):1855. DOI: https://doi.org/10.3390/v14091855
Supplementary files

