

")


使用R语言进行研究假设检验
- 作者: Blokhin I.A.1, Kodenko M.R.1,2, Shumskaya Y.F.1,3, Gonchar A.P.1, Reshetnikov R.V.1
-
隶属关系:
- Moscow Center for Diagnostics and Telemedicine
- Bauman Moscow State Technical University
- The First Sechenov Moscow State Medical University
- 期: 卷 4, 编号 2 (2023)
- 页面: 238-247
- 栏目: Editorials
- URL: https://journals.rcsi.science/DD/article/view/146889
- DOI: https://doi.org/10.17816/DD121368
- ID: 146889
如何引用文章

详细
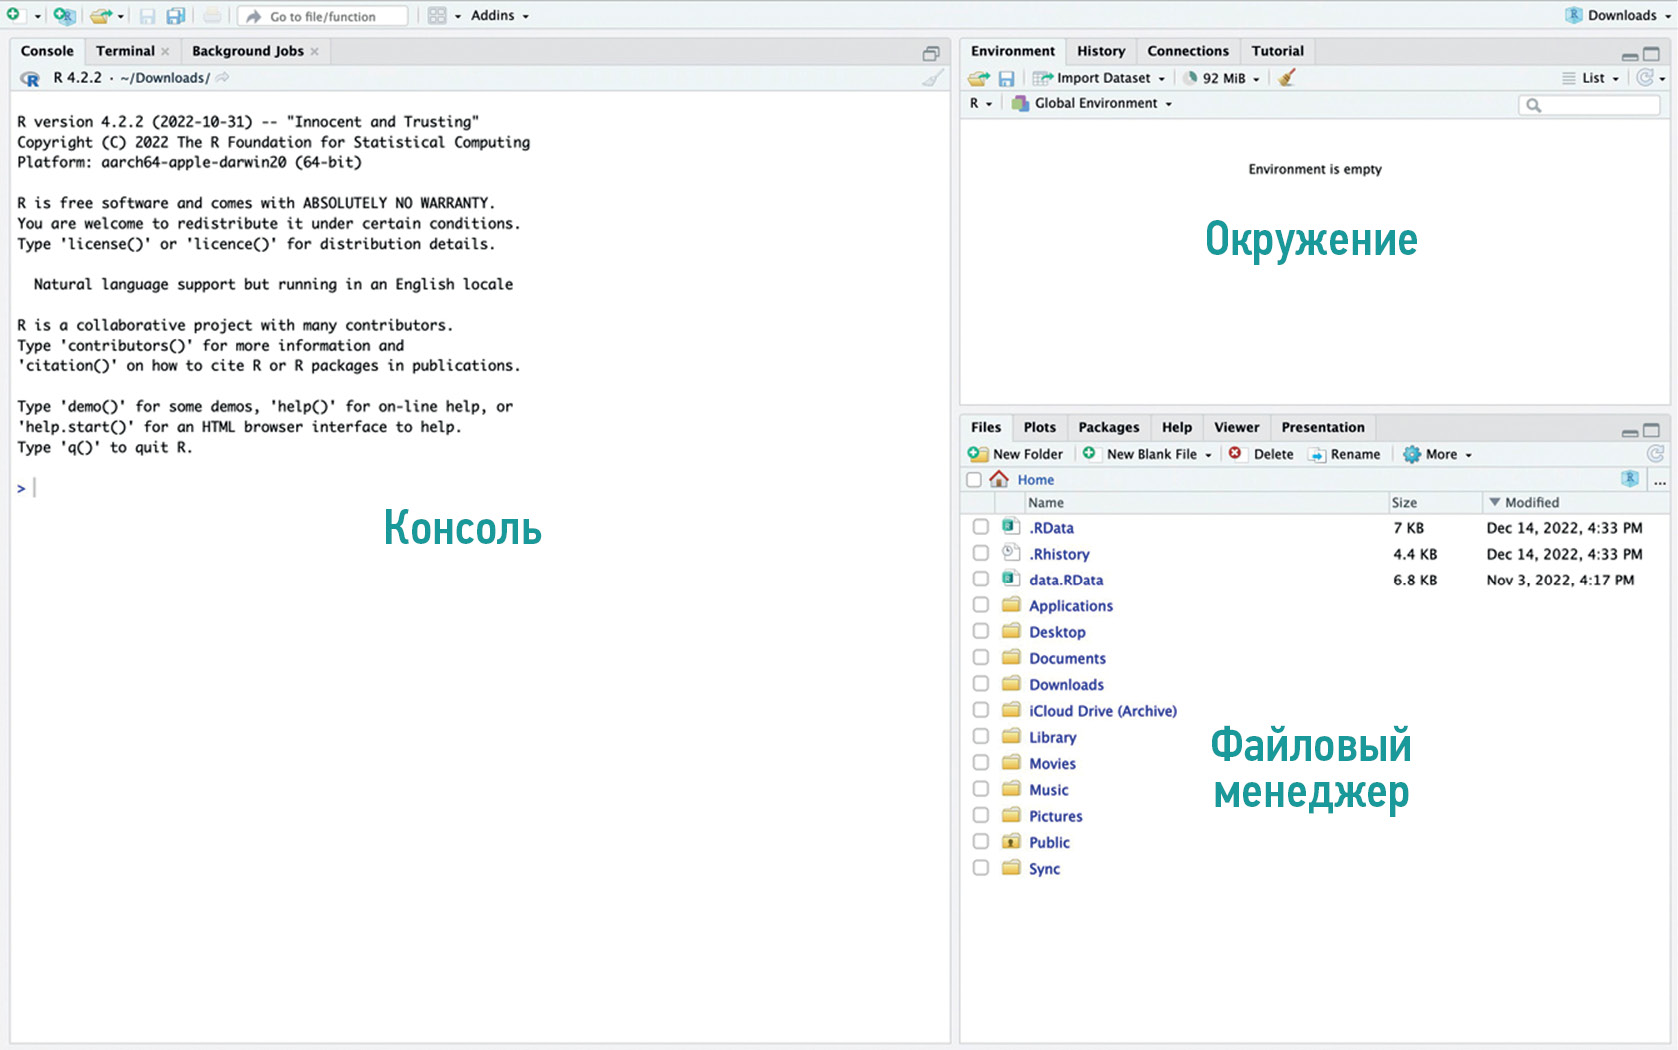
对于现代科学家来说,统计数据处理的能力越来越重要。用于统计分析的开源软 件(open-source software)的明显优势是可用性和多功能性。在免费的解决方案中, R语言和相关软件大有可为,可作为一个最简控制台界面或作为一个完全合格的开发环境RStudio/Posit。
我们提供一份使用R语言工具比较两组数据的实用指南,以COVID-19的标准电子计算机断层扫描和低剂量电脑断层扫描的有效剂量比较为例。本指南简略地总结了医学数据处理的理论方法,以及正确制定研究目标和选择最佳统计分析方法的建议。
本实用指南的主要目的是通过一个解决真实医学问题的实际例子向读者介绍Posit界面和R语言的基本功能。所介绍的材料在借助R语言工具掌握统计分析的初始阶段可以有益处。
作者简介
Ivan A. Blokhin
Moscow Center for Diagnostics and Telemedicine
Email: i.blokhin@npcmr.ru
ORCID iD: 0000-0002-2681-9378
SPIN 代码: 3306-1387
俄罗斯联邦, Moscow
Maria R. Kodenko
Moscow Center for Diagnostics and Telemedicine; Bauman Moscow State Technical University
Email: KodenkoMR@zdrav.mos.ru
ORCID iD: 0000-0002-0166-3768
SPIN 代码: 5789-0319
俄罗斯联邦, Moscow; Moscow
Yuliya F. Shumskaya
Moscow Center for Diagnostics and Telemedicine; The First Sechenov Moscow State Medical University
Email: ShumskayaYF@zdrav.mos.ru
ORCID iD: 0000-0002-8521-4045
SPIN 代码: 3164-5518
俄罗斯联邦, Moscow; Moscow
Anna P. Gonchar
Moscow Center for Diagnostics and Telemedicine
Email: a.gonchar@npcmr.ru
ORCID iD: 0000-0001-5161-6540
SPIN 代码: 3513-9531
俄罗斯联邦, Moscow
Roman V. Reshetnikov
Moscow Center for Diagnostics and Telemedicine
编辑信件的主要联系方式.
Email: r.reshetnikov@npcmr.ru
ORCID iD: 0000-0002-9661-0254
SPIN 代码: 8592-0558
Cand. Sci. (Phys-Math)
俄罗斯联邦, Moscow参考
- Emerson J, Colditz GA. Use of statistical analysis in the New England Journal of Medicine. New Engl J Med. 1983;309(12):709–713. doi: 10.1056/NEJM198309223091206
- Ali Z, Bhaskar SB. Basic statistical tools in research and data analysis. Indian J Anaesth. 2016;60(9):662–669. doi: 10.4103/0019-5049.190623
- Mishra P, Pandey CM, Singh U, et al. Selection of appropriate statistical methods for data analysis. Ann Card Anaesth. 2019;22(3):297–301. doi: 10.4103/aca.ACA_248_18
- Dwivedi AK, Shukla R. Evidence-based statistical analysis and methods in biomedical research (SAMBR) checklists according to design features. Cancer Rep (Hoboken). 2020;3(4):e1211. doi: 10.1002/cnr2.1211
- Rigby PC, German DM, Cowen L, et al. Peer review on open-source software projects: Parameters, statistical models, and theory. ACM Trans Softw Eng Methodol. 2014;23(4):35.
- Culpepper SA, Aguinis H. R is for revolution: A cutting-edge, free, open source statistical package. Organizational Research Methods. 2011;14(4):735–740.
- Ihaka R, Gentleman R. R: A language for data analysis and graphics. J Computational Graphical Statistics. 1996;5(3):299–314. doi: 10.1080/10618600.1996.10474713
- Niu G, Segall RS, Zhao Z, et al. A survey of open source statistical software (OSSS) and their data processing functionalities. Int J Open Source Software Processes. 2021;12(1):1–20. doi: 10.4018/IJOSSP.2021010101
- Shatenok MP, Ryzhov SA, Lantukh ZA, et al. Patient dose monitoring software in radiology. Digital Diagnostics. 2022;3(3):212–230. (In Russ). doi: 10.17816/DD106083
- Druzhinina UV, Ryzhov SA, Vodovatov AV, et al. Coronavirus Disease-2019: Changes in computed tomography radiation burden across Moscow medical facilities. Digital Diagnostics. 2022;3(1):5–15. (In Russ). doi: 10.17816/DD87628
- Gombolevskiy V, Morozov S, Chernina V, et al. A phantom study to optimise the automatic tube current modulation for chest CT in COVID-19. Eur Radiol Exp. 2021;5(1):21. doi: 10.1186/s41747-021-00218-0
- Blokhin I, Gombolevskiy V, Chernina V, et al. Inter-observer agreement between low-dose and standard-dose CT with soft and sharp convolution kernels in COVID-19 pneumonia. J Clin Med. 2022;11(3):669. doi: 10.3390/jcm11030669
- Blokhin IA, Gonchar AP, Kodenko M, et al. Impact of body mass index on the reliability of the CT0–4 grading system: A comparison of computed tomography protocols. Digital Diagnostics. 2022;3(2):108–118. (In Russ). doi: 10.17816/DD104358
- Kennedy-Shaffer L. Before p<0.05 to beyond p<0.05: Using history to contextualize p-values and significance testing. Am Stat. 2019;73(Suppl. 1):82–90. doi: 10.1080/00031305.2018.1537891
- Romão X, Delgado R, Costa A. An empirical power comparison of univariate goodness-of-fit tests for normality. J Statist Computation Simulat. 2010;80(5):545–591. doi: 10.1080/00949650902740824
- Lumley T, Diehr P, Emerson S, Chen L. The Importance of the normality assumption in large public health data sets. Ann Rev Pub Health. 2002;23(1):151–169. doi: 10.1146/annurev.publhealth.23.100901.140546
- Mishra P, Pandey CM, Singh U, et al. Descriptive statistics and normality tests for statistical data. Ann Card Anaesth. 2019;22(1):67–72. doi: 10.4103/aca.ACA_157_18
补充文件


