

")


Hypothesis testing using R
- Autores: Blokhin I.A.1, Kodenko M.R.1,2, Shumskaya Y.F.1,3, Gonchar A.P.1, Reshetnikov R.V.1
-
Afiliações:
- Moscow Center for Diagnostics and Telemedicine
- Bauman Moscow State Technical University
- The First Sechenov Moscow State Medical University
- Edição: Volume 4, Nº 2 (2023)
- Páginas: 238-247
- Seção: Editorials
- URL: https://journals.rcsi.science/DD/article/view/146889
- DOI: https://doi.org/10.17816/DD121368
- ID: 146889
Citar

Resumo
Competencies in statistical data processing are becoming increasingly important for modern scientists. The apparent advantages of open-source software for statistical analysis are its accessibility and adaptability. The programming language and the corresponding software R, available as a minimalistic console interface or a complete development environment RStudio/Posit, have the widest possibilities among free solutions.
We present a practical guide for comparing two groups using the software R. This study compares the effective doses of standard computed tomography with low-dose computed tomography for COVID-19 patients. The practical guide summarizes theoretical approaches to medical data processing and recommendations for correctly formulating research tasks and selecting optimal statistical analysis methods.
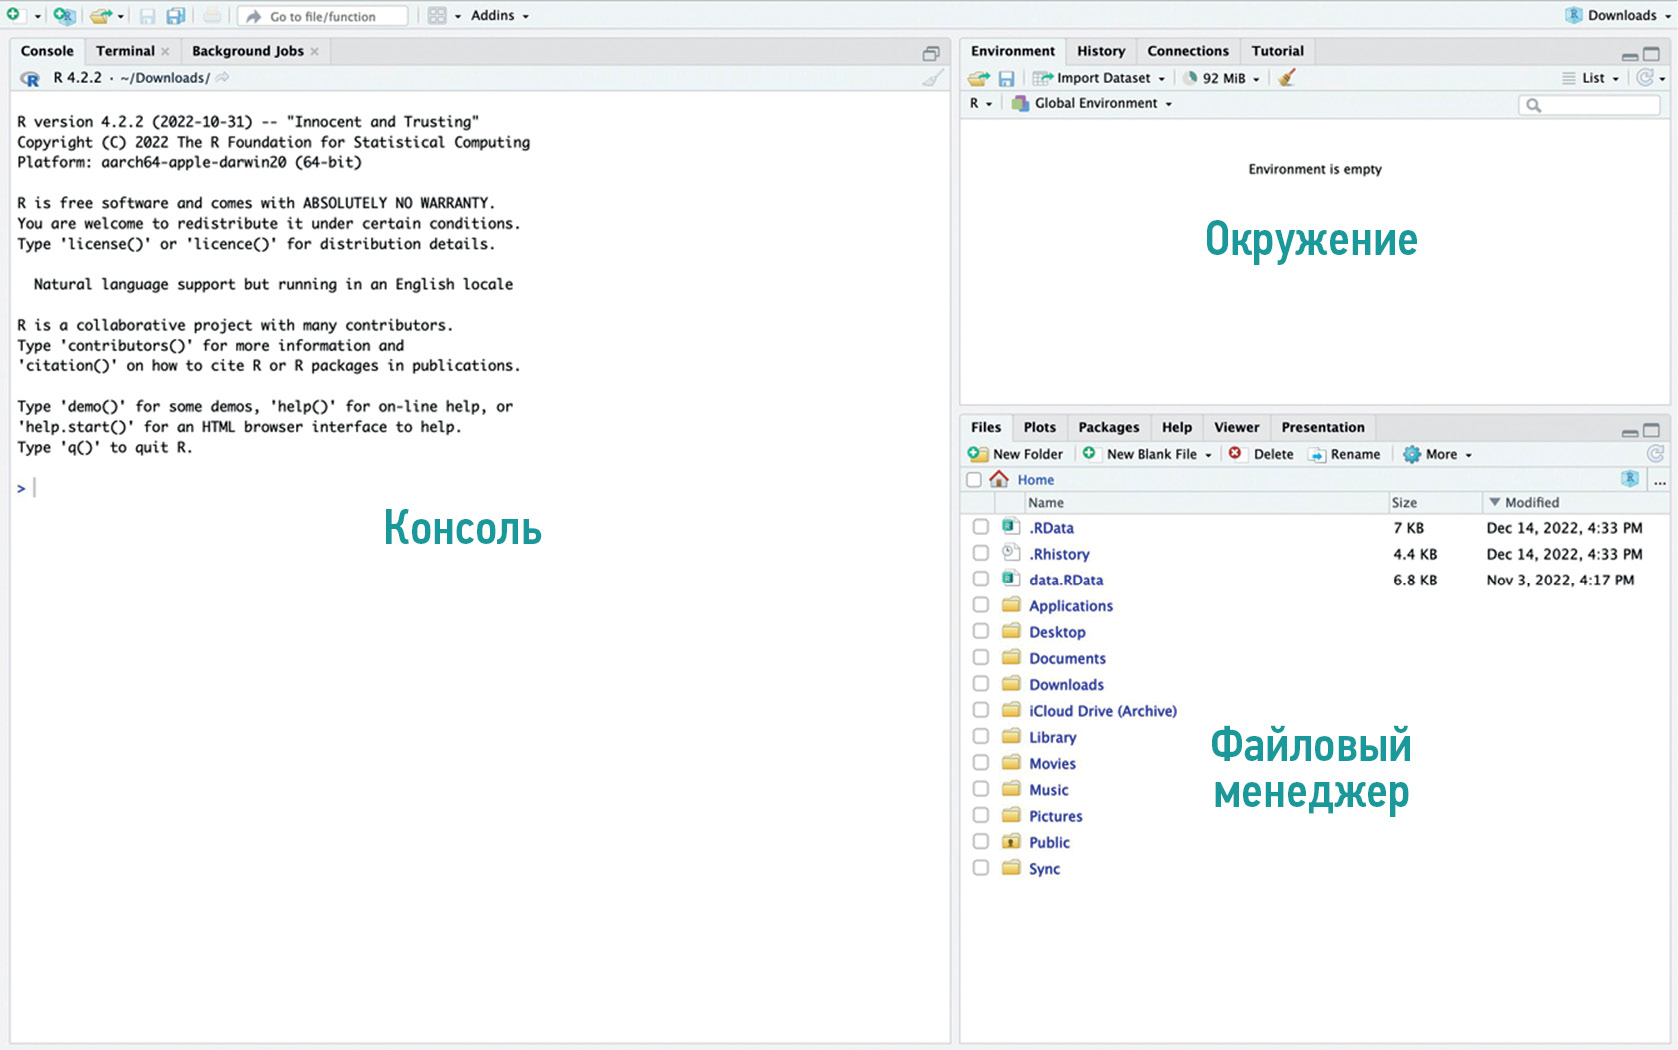
The main goal of the practical guide is to introduce the reader to the Posit interface and the basic functionality of the R language by using a practical example of treating a real medical problem. The presented material can be useful as an introduction to statistical analysis using the programming language R.
Palavras-chave
Texto integral
##article.viewOnOriginalSite##Sobre autores
Ivan Blokhin
Moscow Center for Diagnostics and Telemedicine
Email: i.blokhin@npcmr.ru
ORCID ID: 0000-0002-2681-9378
Código SPIN: 3306-1387
Rússia, Moscow
Maria Kodenko
Moscow Center for Diagnostics and Telemedicine; Bauman Moscow State Technical University
Email: KodenkoMR@zdrav.mos.ru
ORCID ID: 0000-0002-0166-3768
Código SPIN: 5789-0319
Rússia, Moscow; Moscow
Yuliya Shumskaya
Moscow Center for Diagnostics and Telemedicine; The First Sechenov Moscow State Medical University
Email: ShumskayaYF@zdrav.mos.ru
ORCID ID: 0000-0002-8521-4045
Código SPIN: 3164-5518
Rússia, Moscow; Moscow
Anna Gonchar
Moscow Center for Diagnostics and Telemedicine
Email: a.gonchar@npcmr.ru
ORCID ID: 0000-0001-5161-6540
Código SPIN: 3513-9531
Rússia, Moscow
Roman Reshetnikov
Moscow Center for Diagnostics and Telemedicine
Autor responsável pela correspondência
Email: r.reshetnikov@npcmr.ru
ORCID ID: 0000-0002-9661-0254
Código SPIN: 8592-0558
Cand. Sci. (Phys-Math)
Rússia, MoscowBibliografia
- Emerson J, Colditz GA. Use of statistical analysis in the New England Journal of Medicine. New Engl J Med. 1983;309(12):709–713. doi: 10.1056/NEJM198309223091206
- Ali Z, Bhaskar SB. Basic statistical tools in research and data analysis. Indian J Anaesth. 2016;60(9):662–669. doi: 10.4103/0019-5049.190623
- Mishra P, Pandey CM, Singh U, et al. Selection of appropriate statistical methods for data analysis. Ann Card Anaesth. 2019;22(3):297–301. doi: 10.4103/aca.ACA_248_18
- Dwivedi AK, Shukla R. Evidence-based statistical analysis and methods in biomedical research (SAMBR) checklists according to design features. Cancer Rep (Hoboken). 2020;3(4):e1211. doi: 10.1002/cnr2.1211
- Rigby PC, German DM, Cowen L, et al. Peer review on open-source software projects: Parameters, statistical models, and theory. ACM Trans Softw Eng Methodol. 2014;23(4):35.
- Culpepper SA, Aguinis H. R is for revolution: A cutting-edge, free, open source statistical package. Organizational Research Methods. 2011;14(4):735–740.
- Ihaka R, Gentleman R. R: A language for data analysis and graphics. J Computational Graphical Statistics. 1996;5(3):299–314. doi: 10.1080/10618600.1996.10474713
- Niu G, Segall RS, Zhao Z, et al. A survey of open source statistical software (OSSS) and their data processing functionalities. Int J Open Source Software Processes. 2021;12(1):1–20. doi: 10.4018/IJOSSP.2021010101
- Shatenok MP, Ryzhov SA, Lantukh ZA, et al. Patient dose monitoring software in radiology. Digital Diagnostics. 2022;3(3):212–230. (In Russ). doi: 10.17816/DD106083
- Druzhinina UV, Ryzhov SA, Vodovatov AV, et al. Coronavirus Disease-2019: Changes in computed tomography radiation burden across Moscow medical facilities. Digital Diagnostics. 2022;3(1):5–15. (In Russ). doi: 10.17816/DD87628
- Gombolevskiy V, Morozov S, Chernina V, et al. A phantom study to optimise the automatic tube current modulation for chest CT in COVID-19. Eur Radiol Exp. 2021;5(1):21. doi: 10.1186/s41747-021-00218-0
- Blokhin I, Gombolevskiy V, Chernina V, et al. Inter-observer agreement between low-dose and standard-dose CT with soft and sharp convolution kernels in COVID-19 pneumonia. J Clin Med. 2022;11(3):669. doi: 10.3390/jcm11030669
- Blokhin IA, Gonchar AP, Kodenko M, et al. Impact of body mass index on the reliability of the CT0–4 grading system: A comparison of computed tomography protocols. Digital Diagnostics. 2022;3(2):108–118. (In Russ). doi: 10.17816/DD104358
- Kennedy-Shaffer L. Before p<0.05 to beyond p<0.05: Using history to contextualize p-values and significance testing. Am Stat. 2019;73(Suppl. 1):82–90. doi: 10.1080/00031305.2018.1537891
- Romão X, Delgado R, Costa A. An empirical power comparison of univariate goodness-of-fit tests for normality. J Statist Computation Simulat. 2010;80(5):545–591. doi: 10.1080/00949650902740824
- Lumley T, Diehr P, Emerson S, Chen L. The Importance of the normality assumption in large public health data sets. Ann Rev Pub Health. 2002;23(1):151–169. doi: 10.1146/annurev.publhealth.23.100901.140546
- Mishra P, Pandey CM, Singh U, et al. Descriptive statistics and normality tests for statistical data. Ann Card Anaesth. 2019;22(1):67–72. doi: 10.4103/aca.ACA_157_18
Arquivos suplementares


