

")


Impact of body mass index on the reliability of the CT0–4 grading system: a comparison of computed tomography protocols
- Authors: Blokhin I.A.1, Gonchar A.P.1, Kodenko M.R.1,2, Solovev A.V.1, Gombolevskiy V.A.3, Reshetnikov R.V.1,4
-
Affiliations:
- Moscow Center for Diagnostics and Telemedicine
- Bauman Moscow State Technical University
- Artificial Intelligence Research Institute
- The First Sechenov Moscow State Medical University (Sechenov University)
- Issue: Vol 3, No 2 (2022)
- Pages: 108-118
- Section: Original Study Articles
- URL: https://journals.rcsi.science/DD/article/view/104358
- DOI: https://doi.org/10.17816/DD104358
- ID: 104358
Cite item

Abstract
BACKGROUND: The increased frequency of chest computed tomography utilization in the fight against COVID-19 has made usage of low-dose computed tomography necessary to reduce the radiation dose while preserving diagnostic quality. However, in the published literature, there were no data on the effect of body mass index on low-dose computed tomography accuracy in patients with COVID-19.
AIM: To assess the effect of patient body mass index on the level of agreement between radiologists interpreting standard-dose computed tomography and low-dose computed tomography in COVID-19-associated pneumonia using visual semiquantitative CT 0–4 scale.
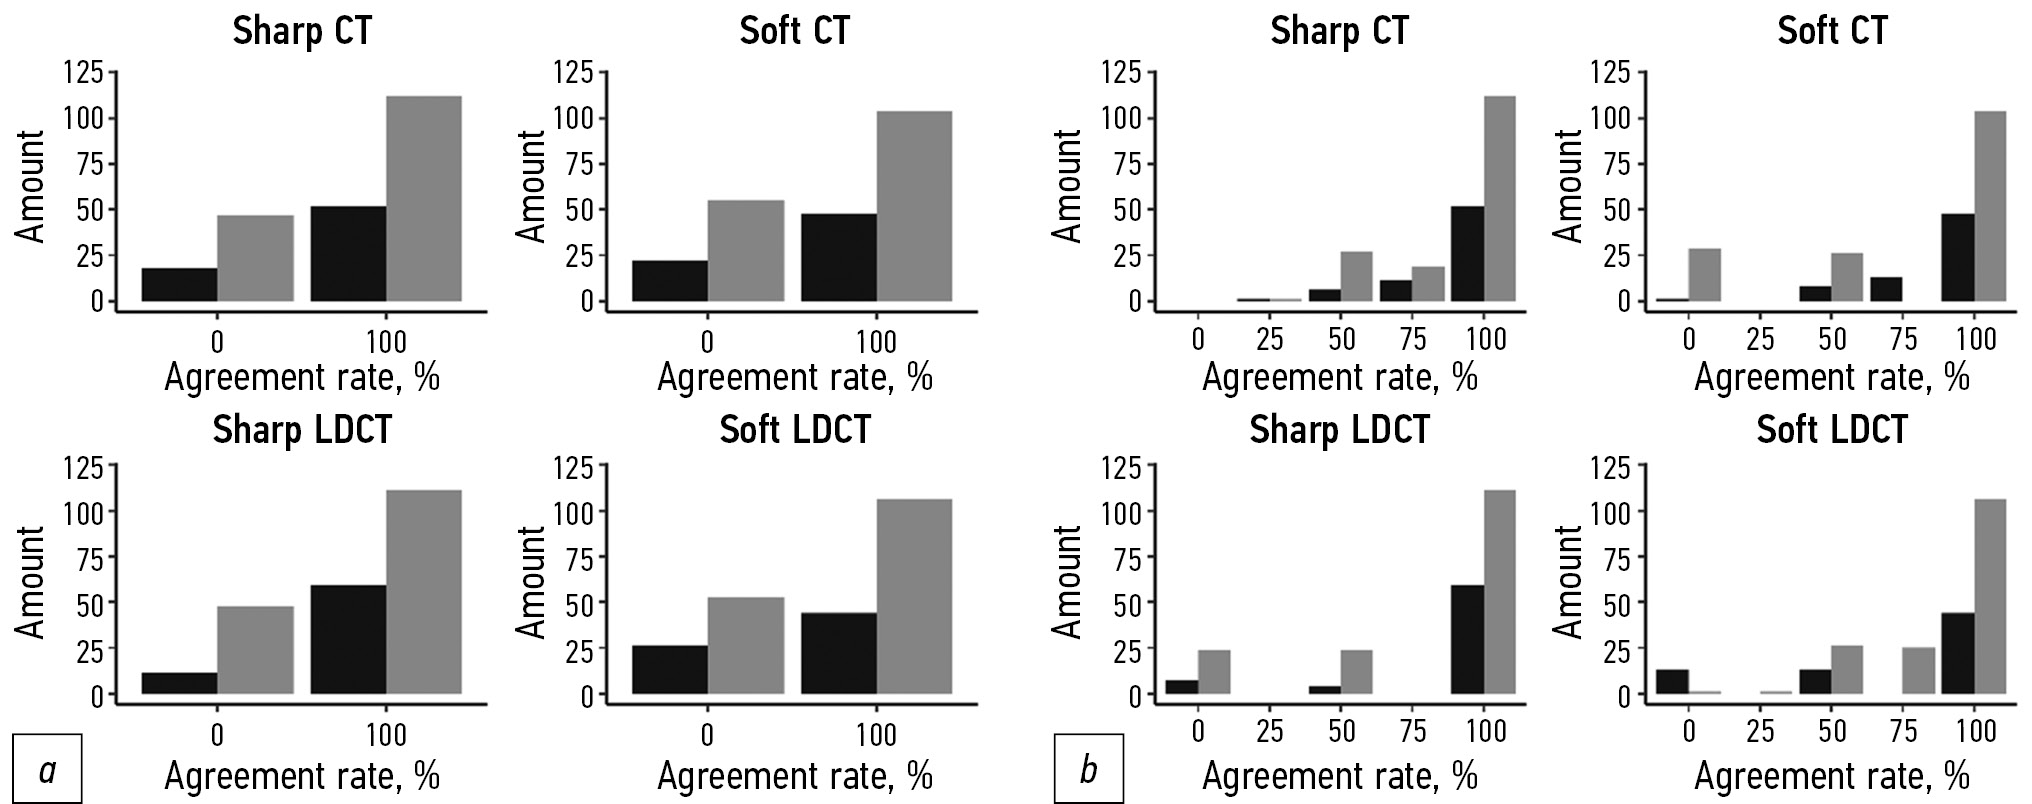
MATERIALS AND METHODS: In this retrospective multicenter study, each participant underwent two consecutive chest scans at a single visit using standard-dose and low-dose protocols. Standard-dose and low-dose computed tomography with pulmonary and soft tissue kernels were interpreted using a visual semiquantitative CT 0–4 grading system. Data for each protocol were grouped by body mass index value (threshold value for pathology was equal to 25 kg/m2). Agreement was calculated based on binary and weighted classifications. One-way ANOVA analysis of variance was used to assess the presence of statistically significant differences in the mean for the groups.
RESULTS: Two hundred thirty patients met the established inclusion criteria for the study. The experts processed 4 studies for each patient: standard-dose and low-dose computed tomography with pulmonary and soft tissue kernels. The proportion of normal-weight patients was 31% (71 subjects), and the sample’s median body mass index was 27.5 (18.3; 48.3) kg/m2. There were no statistically significant differences in intergroup pairwise comparisons for both the binary and weighted classifications (p values were 0.09 and 0.12, respectively). The group of overweight patients was further subdivided according to the degrees of obesity; however, the results were invariant to this division (no statistically significant differences: for the most different body mass index groups “normal” and “3rd degree obesity” p-value 0.17).
CONCLUSION: Body mass index does not affect chest standard-dose and low-dose computed tomography interpretation in COVID-19 using the visual semiquantitative CT 0–4 grading system.
Full Text
##article.viewOnOriginalSite##About the authors
Ivan A. Blokhin
Moscow Center for Diagnostics and Telemedicine
Email: i.blokhin@npcmr.ru
ORCID iD: 0000-0002-2681-9378
SPIN-code: 3306-1387
Russian Federation, Moscow
Anna P. Gonchar
Moscow Center for Diagnostics and Telemedicine
Email: a.gonchar@npcmr.ru
ORCID iD: 0000-0001-5161-6540
SPIN-code: 3513-9531
Russian Federation, Moscow
Maria R. Kodenko
Moscow Center for Diagnostics and Telemedicine; Bauman Moscow State Technical University
Author for correspondence.
Email: m.kodenko@npcmr.ru
ORCID iD: 0000-0002-0166-3768
SPIN-code: 5789-0319
Russian Federation, Moscow; Moscow
Alexander V. Solovev
Moscow Center for Diagnostics and Telemedicine
Email: a.solovev@npcmr.ru
ORCID iD: 0000-0003-4485-2638
SPIN-code: 9654-4005
Russian Federation, Moscow
Victor A. Gombolevskiy
Artificial Intelligence Research Institute
Email: g_victor@mail.ru
ORCID iD: 0000-0003-1816-1315
SPIN-code: 6810-3279
MD, Cand. Sci. (Med.)
Russian Federation, MoscowRoman V. Reshetnikov
Moscow Center for Diagnostics and Telemedicine; The First Sechenov Moscow State Medical University (Sechenov University)
Email: reshetnikov@fbb.msu.ru
ORCID iD: 0000-0002-9661-0254
SPIN-code: 8592-0558
Cand. Sci. (Phys.-Math.)
Russian Federation, Moscow; MoscowReferences
- Islam N, Ebrahimzadeh S, Salameh JP, et al. Thoracic imaging tests for the diagnosis of COVID-19. Cochrane Database Syst Rev. 2021;3(3):CD013639. doi: 10.1002/14651858.CD013639.pub4
- Morozov SP, Chernina VY, Blokhin IA, Gombolevskiy V. Chest computed tomography for outcome prediction in laboratory-confirmed COVID-19: a retrospective analysis of 38,051 cases. Digital Diagnostics. 2020;1(1):27–36. doi: 10.17816/DD46791
- Prasad KN, Cole WC, Haase GM. Radiation protection in humans: extending the concept of as low as reasonably achievable (Alara) from dose to biological damage. BJR. 2004;77(914):97–99. doi: 10.1259/bjr/88081058
- Sakane H, Ishida M, Shi L, et al. Biological effects of low-dose chest CT on chromosomal DNA. Radiol. 2020;295(2):439–445. doi: 10.1148/radiol.2020190389
- Du Y, Lv Y, Zha W, et al. Association of body mass index (BMI) with critical COVID-19 and in-hospital mortality: a dose-response meta-analysis. Metabolism. 2021;117:154373. doi: 10.1016/j.metabol.2020.154373
- Ohana M, Ludes C, Schaal M, et al. Quel avenir pour la radiographie thoracique face au scanner ultra-low dose? Revue Pneumologie Clinique. 2017;73(1):3–12. doi: 10.1016/j.pneumo.2016.09.007
- Manowitz A, Sedlar M, Griffon M, et al. Use of BMI guidelines and individual dose tracking to minimize radiation exposure from low-dose helical chest CT scanning in a lung cancer screening program. Academ Radiol. 2012;19(1):84–88. doi: 10.1016/j.acra.2011.09.015
- Paul NS, Kashani H, Odedra D, et al. The influence of chest wall tissue composition in determining image noise during cardiac CT. Am J Roentgenol. 2011;197(6):1328–1334. doi: 10.2214/AJR.11.6816
- Blokhin I, Gombolevskiy V, Chernina V, et al. Inter-observer agreement between low-dose and standard-dose CT with soft and sharp convolution kernels in COVID-19 pneumonia. J Clin Med. 2022;11(3):669. doi: 10.3390/jcm11030669
- Morozov SP, Gombolevskiy VA, Elizarov AB, et al. A simplified cluster model and a tool adapted for collaborative labeling of lung cancer CT scans. Computer Methods Programs Biomed. 2021;206:106111. doi: 10.1016/j.cmpb.2021.106111
- Powell-Wiley TM, Poirier P, Burke LE, et al. Obesity and cardiovascular disease: a scientific statement from the American Heart Association. Circulation. 2021;143(21):e984–e1010. doi: 10.1161/CIR.0000000000000973
- The R Foundation. The R Project for Statistical Computing [Internet]. Available from: . Accessed: 15.03.2022.
- Fisher RA. XXI. ―On the dominance ratio. Proceedings Royal Soc Edinburgh. 1923;42:321–341. doi: 10.1017/S0370164600023993
- Levene H. Robust tests for equality of variances. In: Olkin I, Ghurye S, Hoeffding W, et al. Contributions to probability and statistics: essays in honor of harold hotelling. Standford University Press; 1961. Р. 279–292.
- Mosteller F. Data analysis and regression: a second course in statistics. Addison-Wesley Pub. Co., Boston; 1977. 588 p.
- Kubo T, Ohno Y, Nishino M, et al. Low dose chest CT protocol (50 mas) as a routine protocol for comprehensive assessment of intrathoracic abnormality. Eur J Radiol Open. 2016;3:86–94. doi: 10.1016/j.ejro.2016.04.001
- Silin АY, Gruzdev IS, Morozov SP. The influence of model iterative reconstruction on the image quality in standard and low-dose computer tomography of the chest. Experimental study. J Clin Pract. 2020;11(4):49–54. doi: 10.17816/clinpract34900
- Zhu Z, Ming ZX, Feng ZY, et al. Feasibility study of using gemstone spectral imaging (GSI) and adaptive statistical iterative reconstruction (ASIR) for reducing radiation and iodine contrast dose in abdominal CT patients with high BMI values. PLOS ONE. 2015;10(6):e0129201. doi: 10.1371/journal.pone.0129201
- Filatova DA, Sinitsin VE, Mershina EA. Opportunities to reduce the radiation exposure during computed tomography to assess the changes in the lungs in patients with COVID-19: use of adaptive statistical iterative reconstruction. Digital Diagnostics. 2021;2(2):94–104. doi: 10.17816/DD62477
- Lee SW, Kim Y, Shim SS, et al. Image quality assessment of ultra-low dose chest CT using sinogram-affirmed iterative reconstruction. Eur Radiol. 2014;24(4):817–826. doi: 10.1007/s00330-013-3090-9
Supplementary files


